Tabela. Basic figures from consolidated financial statement
| in PLN thousand | in EURO thousand | |||
|---|---|---|---|---|
| Basic figures from consolidated statement of comprehensive income | For the year ended 31 December 2019 | For the year ended 31 December 2018 | For the year ended 31 December 2019 | For the year ended 31 December 2018 |
| Revenue from sales | 1 093 001 | 965 848 | 254 080 | 226 358 |
| Cost of sales | - 963 229 | - 829 097 | - 223 913 | - 194 309 |
| Costs of compensation for stranded costs | - 7 237 | - 119 825 | - 1 682 | - 28 082 |
| Operating profit | 104 014 | 13 030 | 24 179 | 3 054 |
| Profit before tax | 106 450 | 15 110 | 24 745 | 3 541 |
| Net profit | 83 827 | 6 848 | 19 486 | 1 605 |
| Net profit for the period attributable to ordinary shareholders | 82 917,00 | 7 577,00 | 19 273,95 | 1775,76 |
| Net profit for the period attributable to non- controlling interests | 910 | - 729 | 212 | - 171 |
| Basic earnings per share (in PLN/EUR) | 5,56 | 0,51 | 1,29 | 0,12 |
| Other comprehensive income, net of tax | - 684 | - 671 | - 159 | - 157 |
| Total comprehensive income | 83 143 | 6 177 | 19 327 | 1 448 |
| Basic figures from consolidated statement of cash flows | As at 31 December 2019 | As at 31 December 2018 | As at 31 December 2019 | As at 31 December 2018 |
| Non-current assets | 1 826 550 | 1 748 397 | 428 919 | 406 603 |
| Current assets | 760 055 | 648 047 | 178 480 | 150 709 |
| Total assets | 2 586 605 | 2 396 444 | 607 398 | 557 313 |
| Non-current liabilities | 703 766 | 666 629 | 165 261 | 155 030 |
| Current liabilities | 321 786 | 252 099 | 75 563 | 58 628 |
| Equity attributable to ordinary shareholders | 1 556 868 | 1 474 441 | 365 591 | 342 893 |
| Equity attributable to non- controlling interests | 4 185 | 3 275 | 983 | 762 |
| Equity | 1 561 053 | 1 477 716 | 366 573 | 343 655 |
| Number of shares (in thousands) | 14 900 | 14 900 | 14 900 | 14 900 |
| Book value and diluted book value per share (in PLN/EUR) | 104,77 | 99,18 | 24,60 | 23,06 |
Exchange rates of euro used for translation of selected financial data
- Statement of financial position items - average exchange rate announced by NBP as at 31 December 2019 - 4,2585
- Statement of comprehensive income and cash flows items - arithmetic average of average exchange rates announced by NBP as at the end of each mont of the period from 1 January to 31 December 2019 - 4,3018
- Statement of financial position items - average exchange rate announced by NBP as at 31 December 2018 - 4,300
- Statement of comprehensive income and cash flows items - arithmetic average of average exchange rates announced by NBP as at the end of each mont of the period from 1 January to 31 December 2018 r. - 4,2669
Table. Basic ratios (consolidated data)
| (%) | from 1 January to 31 December 2019 | from 1 January to 31 December 2018 | Change (%) |
|---|---|---|---|
| Return on assets (ROA) | 0,47 | 5,71 | - 92 |
| Return on equity (ROE) | 0,77 | 8,84 | - 91 |
| Return on capital employed (ROCE) | 0,79 | 10,68 | - 93 |
Analysis of consolidated net result
Chart. Consolidated financial result of KOGENERACJA S.A. Group
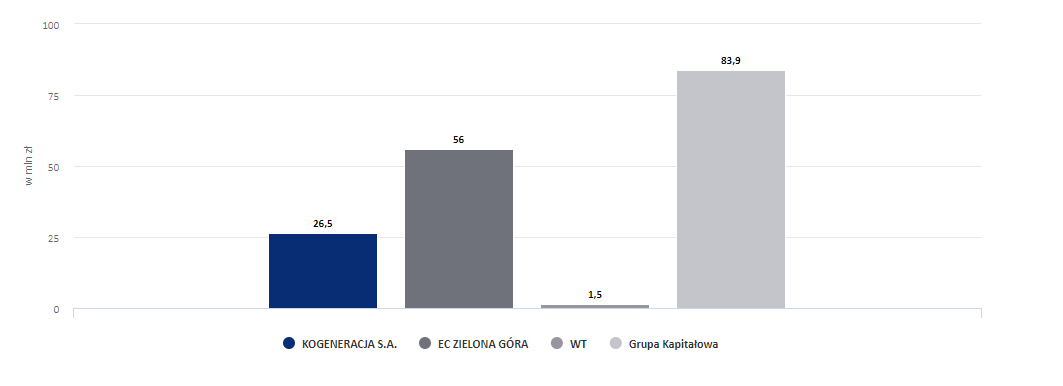
Elimination of intragroup transactions (IT) on the amount 1.5 MPLN refers to consolidation adjustments.
Chart. Analysis of consolidated net result in 2019 compared to 2018
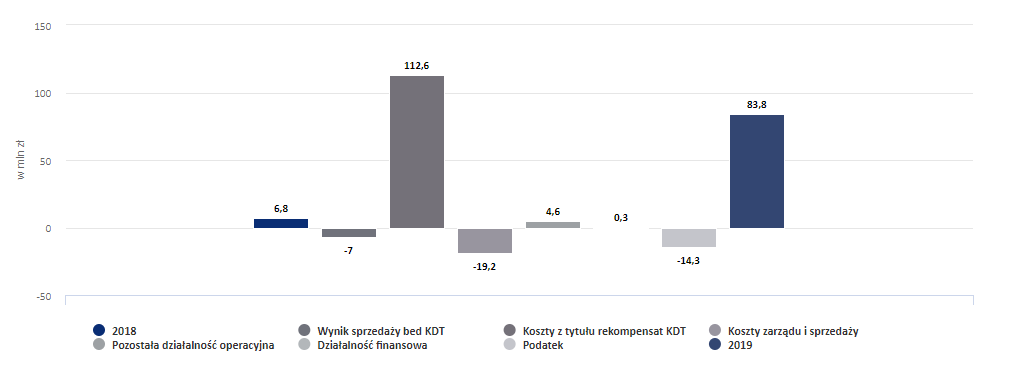
The consolidated net result of 83,8 MPLN was higher than in 2018 by 77 MPLN mainly due to the fact that:
- -7,0 MPLN - lower result on sales:
- +127,2 MPLN higher sales revenues,
- -134,1 MPLN higher cost of sales,
- -19,1 MPLN higher sales and management costs,
- +112,6 MPLN - decrease in PPA costs; change in projected electricity prices to calculate estimated PPA compensation for 2019-2024,
- -19,2 MPLN – increase in sales and management costs,
- +4,6 MPLN - higher result on other operating activities, including:
- -2,0 MPLN increase in the provision for reclamation of landfills,
- +6,4 MPLN valuation of CO2 contracts
- +0,2 MPLN other increases.
- +0,3 MPLN – increase in financing income; higher financing income of+3,1 MPLN, including mainly +3,8 MPLN higher cash-pool interest income and higher financing costs: -2,7 MPLN, including mainly-1,7 MPLN interest on the liability for perpetual usufruct of land, i.e. items previously reported off-balance sheet and after the change in IFRS 16 disclosed in the Group's books, -0,2 MPLN interest on lease,-0,8 MPLN higher discount on stranded costs,
- -14,3 MPLN - higher income tax.
Chart. Consolidated revenues
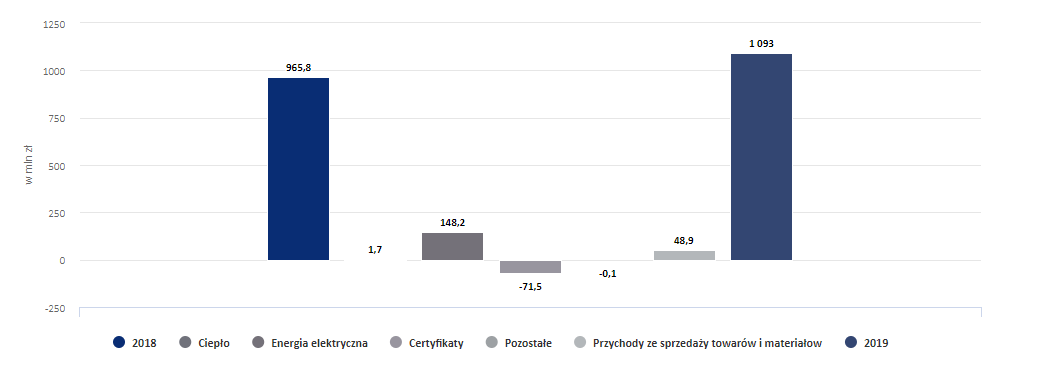
Higher sales revenues as compared to 2018 by 127,2 MPLN (+13%), mainly due to:
- +1,7 MPLN higher revenues from the sale of heat, including by 3,4 MPLN in KOGENERACJA S.A., and lower revenues by 1,7 MPLN in EC Zielona Góra S.A.; Volume of heat sales: the level of 2018 in KOGENERACJA S.A. and a drop by 4% in EC Zielona Góra S.A. Price: positive impact of the increase in average heat prices.
-
+148,2 MPLN – higher revenues from energy sales, including:
- +84,6 MPLN – higher electricity sales price in EC Zielona Góra S.A. and higher sales volume by 7%
- +63,6 MPLN - higher electricity sales revenues in the Parent Company (higher electricity sales prices by approx. 38% and higher sales volume by 6%),
- -71,5 MPLN lower revenues from the sale of certificates: lower revenues from the sale of yellow certificates by 60,8 MPLN in EC Zielona Góra S.A., lower revenues by 10,7 MPLN from the sale of certificates in KOGENERACJA S.A.,
- +48,9 MPLN higher revenues from the sale of goods and materials, including mainly: higher revenues from the sale of electricity in EC Zielona Góra S.A.,
- -0,1 MPLN lower other revenue.
Consolidated fixed and variable costs
Chart. Fixed costs
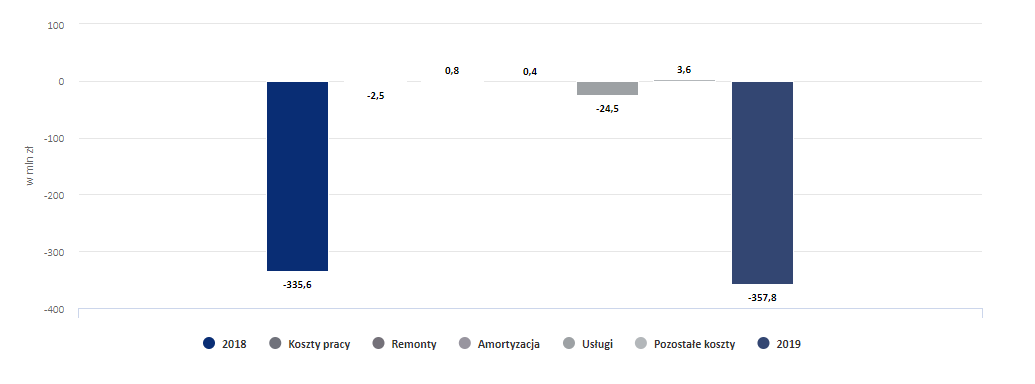
Fixed costs were higher than in 2018 by 22.2 MPLN (7%).
Staff costs increased by 2.5 MPLN; higher staff costs by 1.9 MPLN in KOGENERACJA S.A. and higher staff costs by 0.6 mln in EC Zielona Góra S.A.
Repairs costs increased by 0.8 MPLN. Increase in overhaul costs in the Parent Company by 1.2 MPLN and decrease by 0.4 MPLN in EC Zielona Góra S.A.
Depreciation decreased by 0.4 MPLN. Depreciation decreased by 8.6 MPLN in EC Zielona Góra S.A. as a result of extending the useful life of the auxiliary equipment of the CCGT unit until 2036. Increase in depreciation expense by 8.2MPLN in the Parent Undertaking due to: purchase of new property, plant and equipment (up by 10MPLN), application of IFRS 16 (up by 1 MPLN) and changes in the useful lives of property, plant and equipment (down by 2.8 MPLN).
Costs of services increased by 24.5 MPLN, while other fixed costs decreased by 3.6 MPLN.
Chart. Variable costs
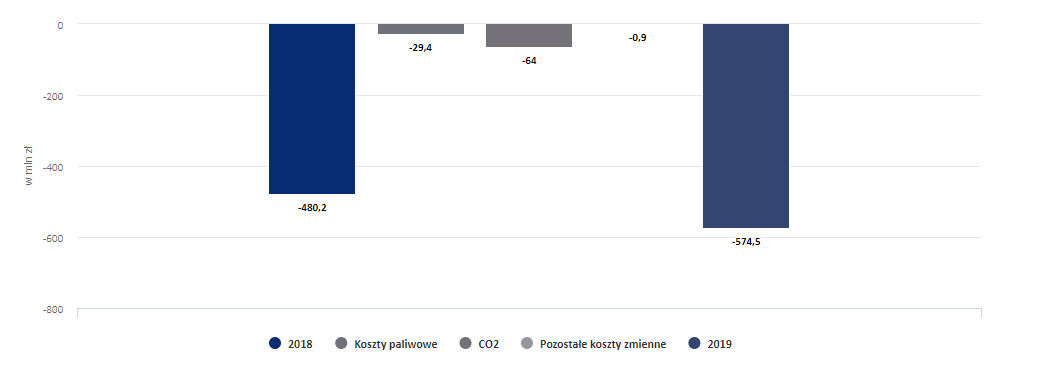
Variable costs were higher by 94,3 MPLN.compared to 2018.
The costs of CO2 shortage and purchase increased by 64 MPLN (45,0 MPLN IN KOGENERACJI S.A., 19 MPLN in EC Zielona Góra S.A.). The increase in costs resulted from two factors: a higher purchase price of missing allowances and a higher shortage of allowances.
The average allowance purchase price was more than twice as high as in 2018. Free CO2 allowances received in 2019 covered 24% of the emissions in KOGENERACJA S.A. and 7% in EC Zielona Góra S.A., CO2 allowances received in 2018 covered 30% of the emissions in KOGENERACJA S.A. and 8% in EC Zielona Góra S.A. CO2 emission in the Group was lower by about 2% than in 2018.
Fuel costs increased by 29,4 MPLN:
-
-20,6 MPLN; higher coal purchase costs:
- +5,4 MPLN; lower volume of burnt coal (in 2019: 16,600 TJ, in 2018: 17,053 TJ),
- -26,3 MPLN;higher coal price by about 13%,
-
-3,6 MPLN;higher costs of biomass consumption:
- -2,2 MPLN higher volume of burnt biomass (in 2019: 415 TJ, in 2018: 349 TJ),
- -1,4 MPLN higher biomass price by about 25%.
- -3,6 MPLN higher costs of gas consumption; -2.6 MPLN higher costs of gas consumption in EC Zielona Góra S.A., lower volume and higher price of gas consumption and -1.0MPLN higher costs of gas consumption due to higher price of consumption in KOGENERACJA S.A.
- -1,3 MPLN higher costs of liquid fuels and chemicals consumption.
Other variable costs increased by PLN 0.9 million due to increased costs related to the functioning of the electricity market.
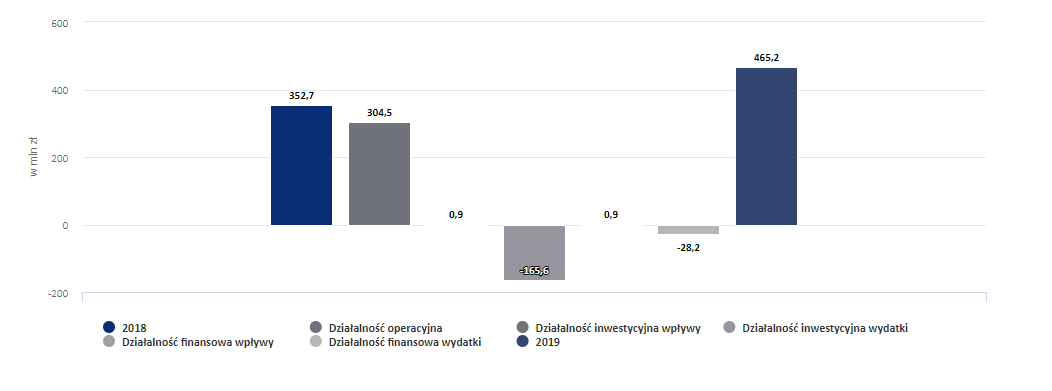
Consolidated financial flows